A happy new year.
We want to keep good cooperation with you in this year as the same as usual.
We would like to introduce some statistics for 2006 which is related with our working.
1.Our company statistic of bulbs supply
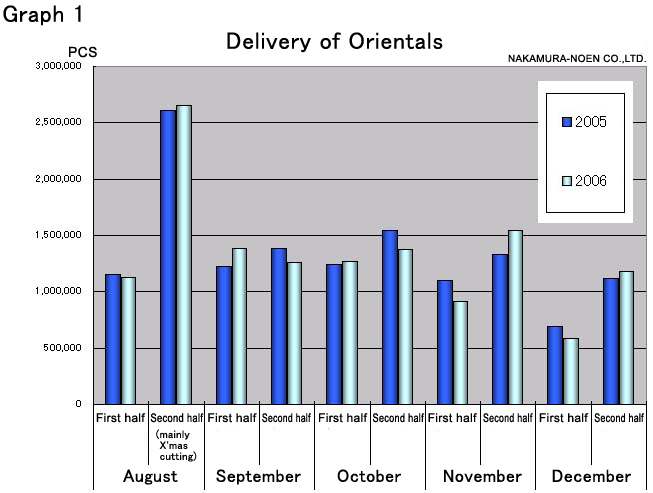
Looking at Graph 1, this statistic of Oriental bulbs delivery is tailed up separately for the half back and forth in each month after August (which is mainly late forcing period in West Japan).
We didn’t find any noticeable difference between this year & last year and the number of monthly supply was almost the same as last year. Of course, we can not see other companies’ circumstance and it may have some difference in each area. But we think the planting time was not a big change in Western Japan.
We doubt for the theory that planting was done earlier to decrease fuel cost (as far as we see our company’s delivery).
2.The statistic of deliver of the Southern Hemisphere bulbs (SH)
the number of imported SH 06’ bulbs
| NZ | CH | Total | |
| August | 936,655 | 0 | 936,655 |
| September | 5,248,935 | 4,201,360 | 9,450,295 |
| October | 4,100,875 | 4,376,135 | 8,477,010 |
| November | 552,860 | 2,272,044 | 2,824,904 |
| December | 0 | 0 | 0 |
| Total | 10,839,325 | 10,849,539 | 21,688,864 |
(from Plant Quarantine)
reference)
SH crop 2005 (NZ)11,950,830 (CH)8,337,538 (total)20,288,368
As specified above, the number of imported SH bulbs in Japan is about 21,700,000, it fell below 25 millions which was expected until harvest season.
And also in this season, a big production group in Kanto-district had changed from Netherlands(NL) to SH, so the number of the distribution expect them will be the same as last year.
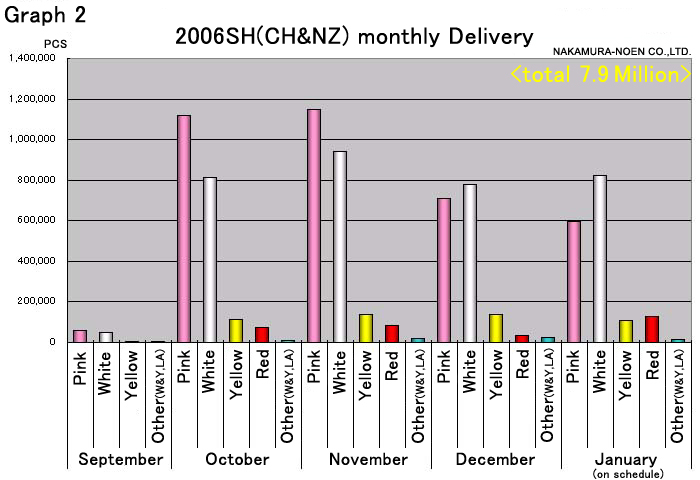
Looking at Graph 2, the statistic of SH crop 06’ monthly delivery by each color is tallied up only the SH bulbs in Graph 1.
Comparing with several years ago, the number of delivery per month from October to January is stabilized. Because, Using SH bulbs for planting after October become common knowledge for quality side. And in case thinking of added cooling cost etc. of long stored NL bulbs, using SH bulbs is more reasonable (we take cooling charge from December).
Planting SH bulbs in January (including delivery plan) is becoming common. While harvest & breaking dormancy being late ( NL crop 06’) by influence of global warming, SH bulbs can be always delivered(planted) , early to sprout after planting and quicker growth than NL in necessary heating season, has advantage in cutting for April to Mother’s Day.
And also, by dispersing cut flowers with NL new bulbs, it is expected to prevent concentrated cutting after the end of May.
We would like to be consulted about suitable variety, size and production etc.
3.The climate of 2006
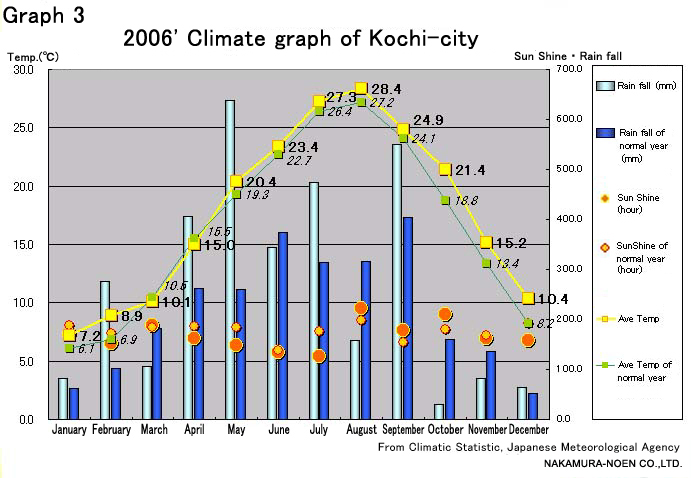
Looking at Graph 3, it is a monthly climate graph of Kochi-city
The average of monthly temperature were higher than common year from May to December in 2006.The annual average temperature was also 1℃ up.
Especially comparing with common year, this year abnormally high temperature continued as August(+1.2℃),October(+1.8℃), December(+2.2℃), then cutting schedule in December seemed to 2~3 weeks earlier.
The climate is various depend on each area in Japan, you may refer it as tendency.
4.The statistic of Oriental cut lily’s in Japanese market
Looking at the arrival statistic of major market in Kanto (There is no statistic of nationwide circumstance), August was less than common year, September was increased, October was little decreased, November was decreased, December was the same as last year.
Noticeable changing in each prefecture was, Hokkai-do little kept off the supply in August, and increased in September〔which was demanded). Niigata-ken decreased the supply in August and September, and big increased in October, November and December.
The monthly average price of August and September had increased from last year, and it decreased in November and December. The circumstance is different in each market, so we can not affirm this to be nationwide tendency. But we think it is fact that product from summer forcing area had a big influence on market in the second half of 2006.
Unfortunately beginning of this season became heavy for productions in west Japan.
We hope that market and production have understanding each other, to make efficient trading of cut flowers, which is well balanced between supply and demand.
(Sending on 13th of January, it had mistake in below line’s expression. We apologize and correct it.)
5.The movement of imported cut flower
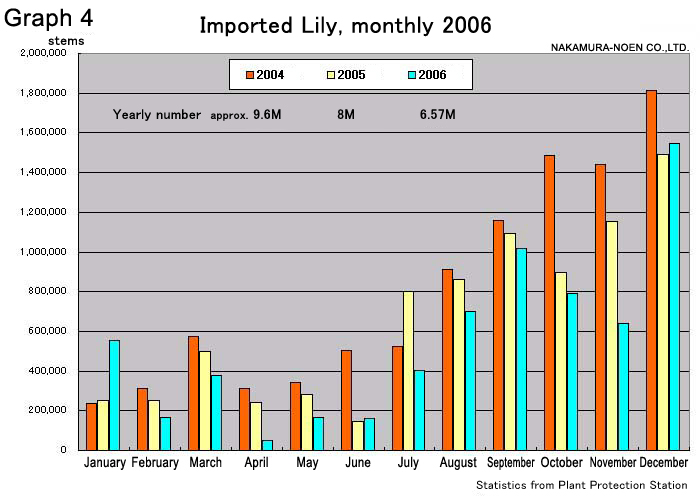
Looking at Graph 4, Change of import cut lilies and 2006 monthly import lilies (from the statistics of plant inspection organization.)
In 2004, Typhoons often hit and the cutting after September were in disorder, instead of that, import cut flowers increased.
After that, it has decreased since 2004(peak year) to 2006, the number of 2006(about 6,570,000) was 82.37% of last year (17.63% decreasing).
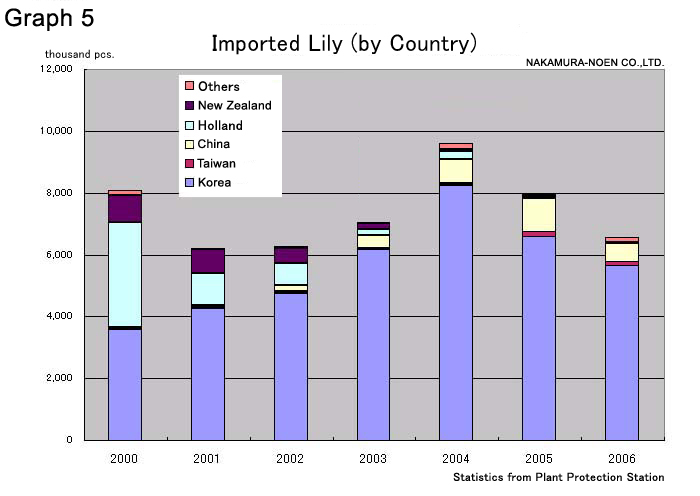
Looking at Graph 5, the quantity decreased in all of each exporting country (Korea, China, Taiwan, Netherlands and New Zealand).
If this circumstance was a sign that regards as high quality domestic product and productions could make scheduled supply for market needs, we would be glad.